Snapshot of the Ongoing Correction in the Uranium Sector
|
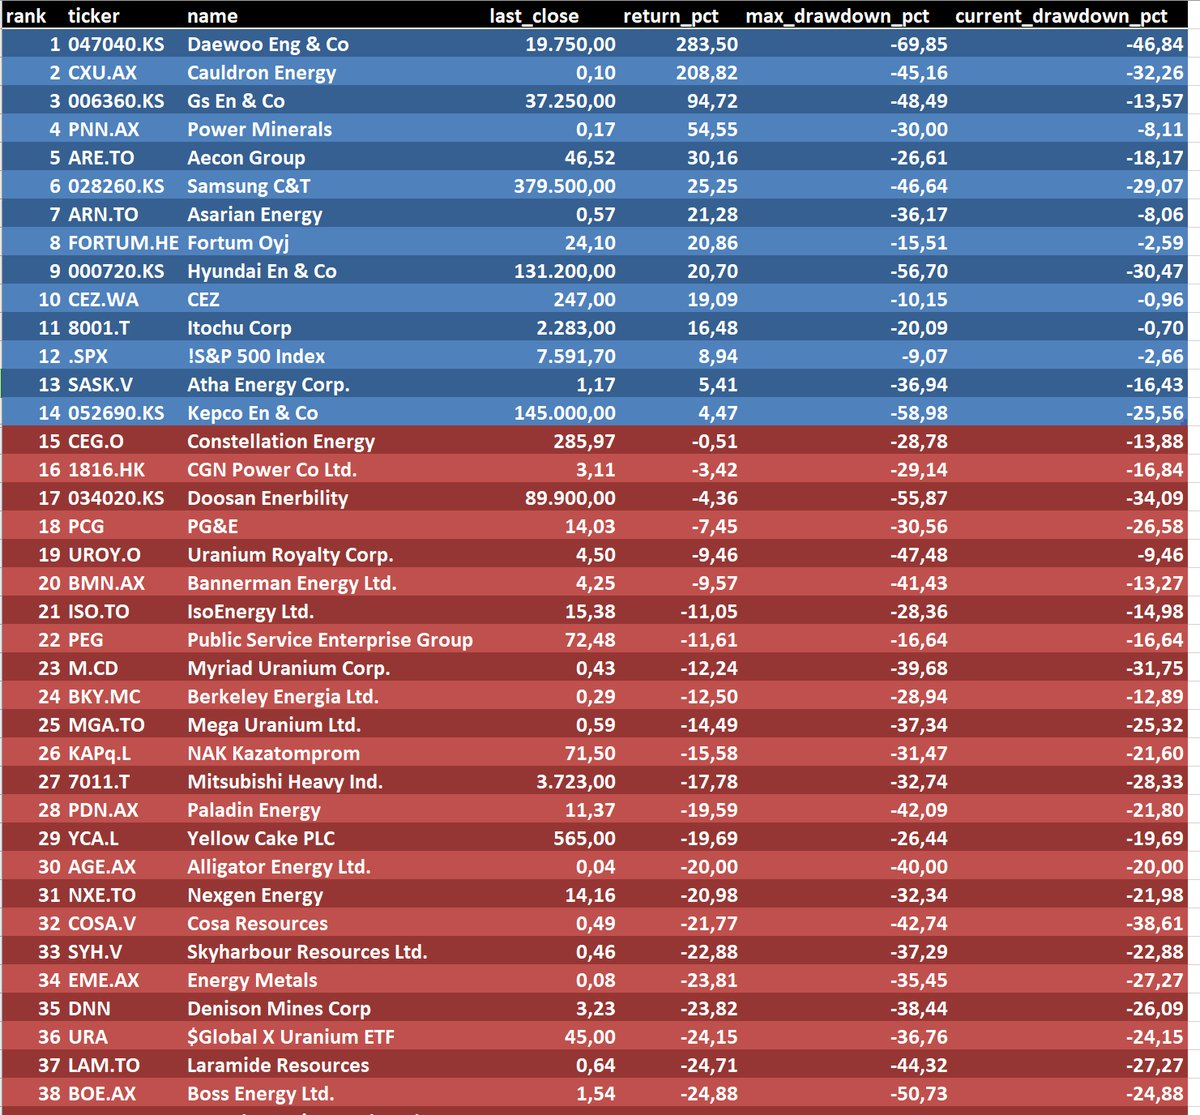
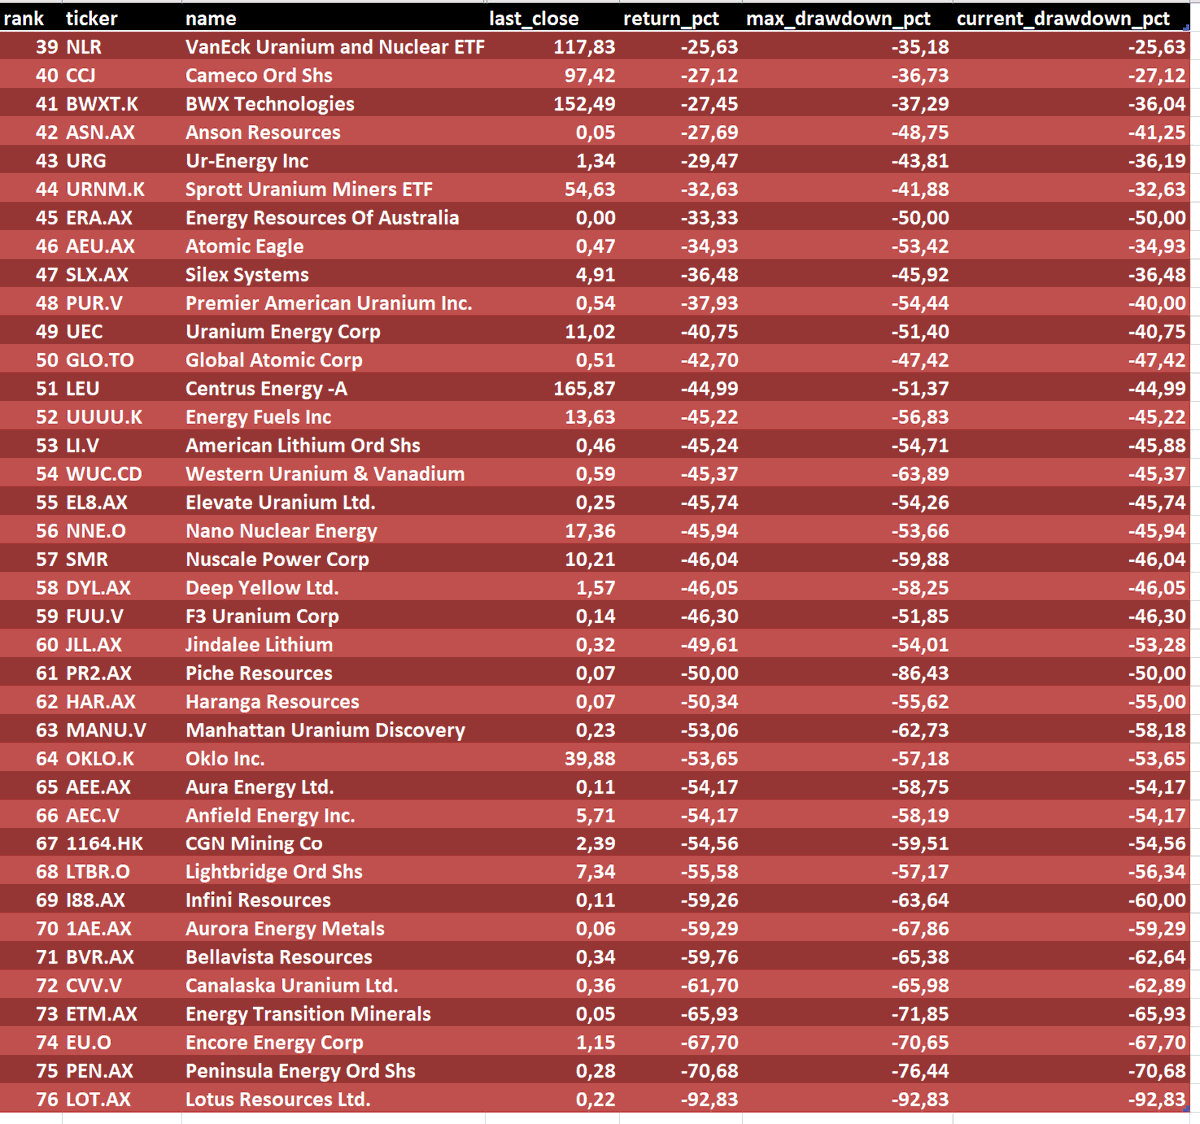
A Snapshot of the Ongoing Correction in the Uranium Sector This table ranks the companies in our uranium universe by performance from January 29 through September 9, 2026. The starting date is not arbitrary: it marks the beginning of the correction that remains in effect across the sector. Here is how to interpret the data:
🔵 Blue: Companies with positive returns since January 29. The Maximum Drawdown column shows the largest peak-to-trough decline experienced by each company during the period. In other words, it measures the worst loss an investor would have endured during the correction. The Current Drawdown column shows how far each company is currently trading below its highest level during the period. The difference between these two drawdowns reveals whether a stock remains near its lows or has already recovered a significant portion of its decline.
The results reveal enormous dispersion. While a handful of companies have delivered extraordinary gains, much of the universe continues to post substantial losses. The We are therefore not yet seeing a broad-based recovery across the sector. There are some clear individual winners, but breadth remains weak, and many companies are still experiencing drawdowns of more than 40%, 50%, or even 60%. The conclusion is clear: stock selection has made an enormous difference in uranium, but the sector-wide correction cannot yet be considered over. |
☢️A Snapshot of the Ongoing Correction in the Uranium Sector
This table ranks the companies in our uranium universe by performance from January 29 through September 9, 2026.
The starting date is not arbitrary: it marks the beginning of the correction that remains in effect… pic.twitter.com/SWhrOrnDCv
— LBroad (@BroadLuis) September 11, 2026